
This project investigates what actually drives foreign tourist arrivals to Turkey, exchange rates, Google search intent, or geopolitical shocks. Using 15 years of monthly data pulled from four sources (EVDS, FRED, Google Trends, TÜİK), I built a full analytics pipeline: API data collection, real exchange rate construction, lag analysis, and OLS demand modelling with Newey-West standard errors. The headline finding: Google Trends leads arrivals by one month, the Russia-Ukraine war caused a structural regime change in Russian flows, and real TRY depreciation carries a modest but real elasticity of roughly +2%.

This project builds a production-grade data warehouse from two messy source systems: a CRM and an ERP that disagree on customer IDs, store dates as integers, and spell gender five different ways. Using the Medallion architecture on Azure SQL, I designed a three-layer pipeline: Bronze for raw ingestion, Silver for cleansing and key harmonization, and Gold for a Kimball star schema ready for BI consumption. The result is a fully reproducible, stored-procedure-driven warehouse with quality checks that prove the model is correct before an analyst ever queries it.
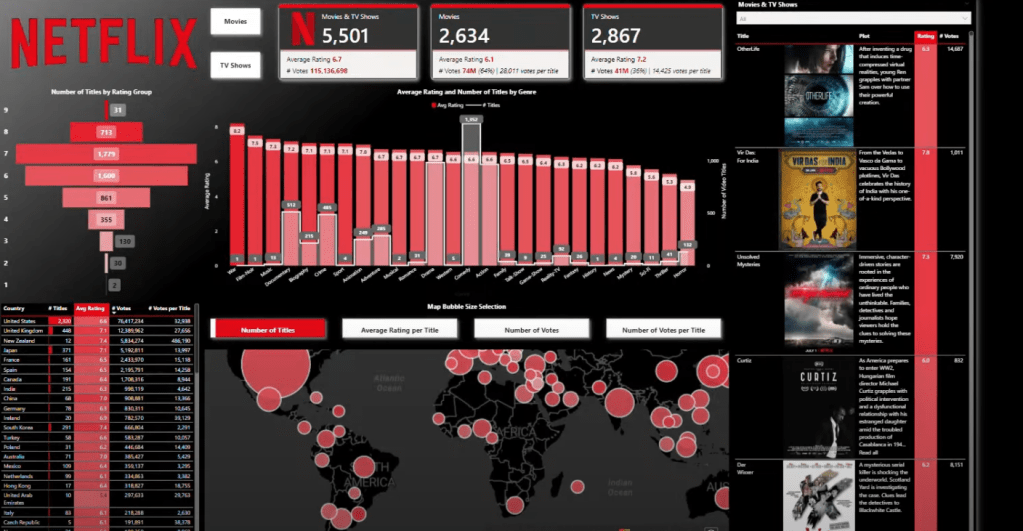
This project centered on analyzing a Netflix dataset, utilizing SQL for selective data extraction and Power BI for visualization. The primary role of SQL was to query and extract specific data subsets, such as viewer ratings, genres, and voting patterns, from the extensive dataset. This selective data extraction was crucial to focus the analysis on relevant aspects, thereby optimizing the dataset for more efficient and targeted visual exploration in Power BI. The strategic use of SQL for data picking laid the groundwork for creating an insightful Power BI dashboard, facilitating a deeper understanding of viewer preferences and aiding in informed decision-making for content and marketing strategies.
