Sales Performance Dashboard Development using Power BI and Python
Tools:
Power Bi & Python
Date:
Fall 2023
Comprehensive Sales Analysis Report
Context and Objective
This report presents a comprehensive analysis of a sales dataset sourced from Kaggle, which simulates the operations of a hypothetical company. The primary aim of this project was not only to delve into the intricate details of sales data but also to extract actionable insights that could be applied in real-world business scenarios. By navigating through the complexities of this rich dataset, the project sought to bridge the gap between theoretical data analysis and practical business applications.
Project Significance
The dataset offered a unique challenge and opportunity: it served as a microcosm of a typical business environment, replete with varied sales channels, diverse product ranges, and complex customer interactions. The analysis was meticulously designed to mirror the decision-making process in a corporate setting, providing a valuable learning experience in handling real-world business data.
Analytical Approach
The approach to this project was multifaceted:
Data Selection: The dataset from Kaggle was specifically chosen for its resemblance to genuine business data. It stood out for its cleanliness, structured format, and the inclusion of diverse elements like multiple currencies, which added a layer of complexity typical of global business operations.
Objective Setting: The end goal was clear from the onset – to unravel the stories hidden within the data. This involved identifying patterns in sales, understanding customer behaviors, and uncovering the underlying factors driving business success.
Methodological Rigor: The project was underpinned by a methodological approach that combined traditional data analysis techniques with advanced tools. This included data cleaning and standardization, exploratory data analysis, and the use of cutting-edge technologies like real-time currency conversion APIs and predictive modeling through machine learning.
Project Scope and Deliverables
The scope of this project extended beyond mere data crunching. It encapsulated a series of interconnected activities:
Data Preprocessing: Ensuring the data’s accuracy and uniformity, particularly in terms of currency conversion, to maintain integrity across different analytical tools.
Exploratory Analysis: Conducting a thorough exploration to understand the nuances of sales trends, product performances, and customer purchasing patterns.
Advanced Visualization: Utilizing tools like Power BI for dynamic and interactive visual representations of the data, offering deeper insights into the dataset.
Predictive Analytics: Applying sophisticated machine learning models to predict future trends and behaviors, thus equipping the hypothetical company with foresight into its operational dynamics.
Approach and Methodology
Data Preparation and Exploration
Data Standardization
The dataset, encompassing 7,991 sales orders, originated with a variety of currencies. Each value was converted to United States Dollars (USD) to ensure uniformity. This standardization was critical for coherent data analysis, allowing for consistent comparisons and aggregations across the dataset.
Exploratory Data Analysis
The initial phase of the project involved a thorough exploratory analysis. This included delving into sales trends over time, examining product performance across various metrics, and scrutinizing customer buying behaviors. Such exploration was instrumental in identifying key areas for deeper analysis and provided a foundational understanding of the dataset’s dynamics.
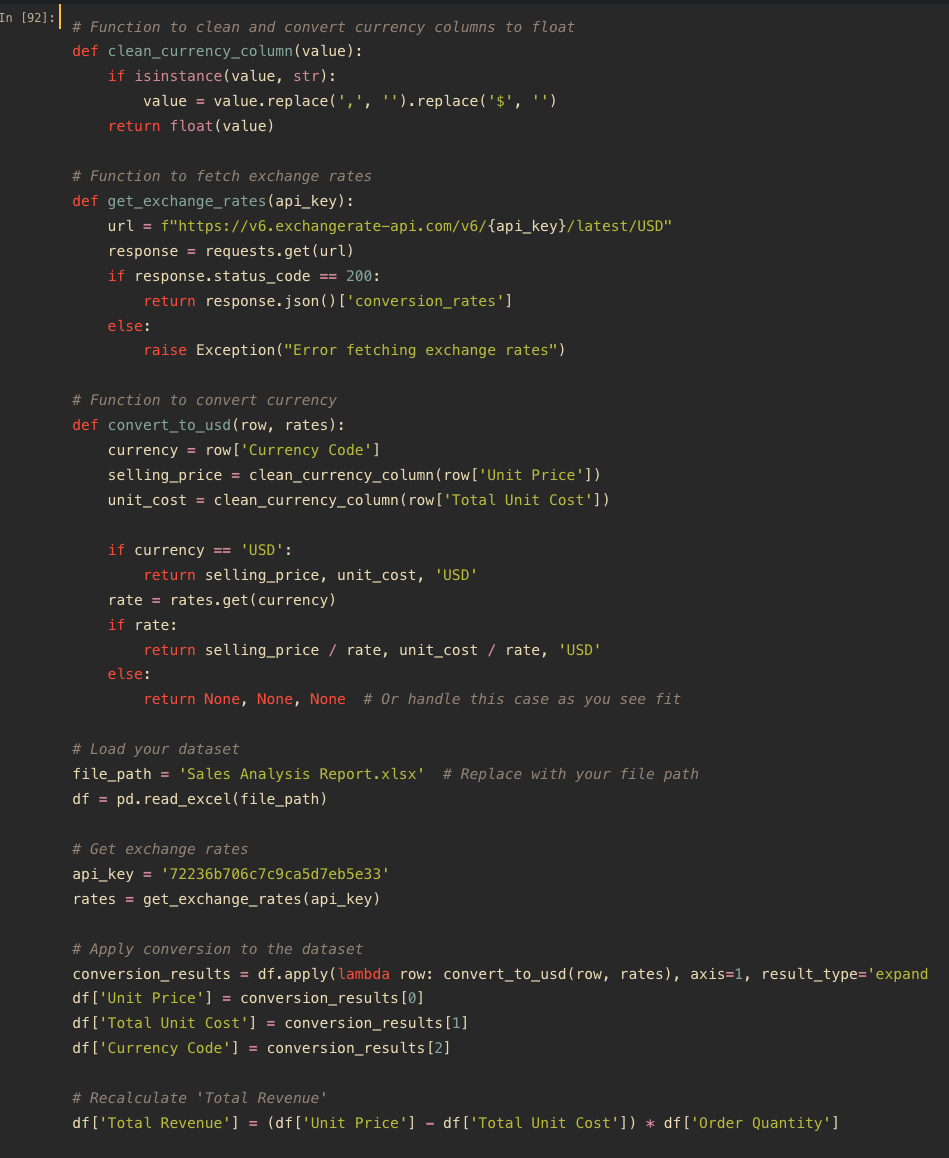
Currency Conversion and Revenue Analysis
Real-time Currency Conversion
To handle the diverse currencies, a real-time currency conversion API was employed. This tool provided the most current exchange rates, ensuring that all financial data reflected up-to-date economic conditions. This step was crucial for maintaining the integrity and relevance of the financial analysis.
Revenue Insights
Post-conversion, data revealed insightful metrics: the average unit price across all orders stood at $2,284.54. More importantly, the average total revenue per order was calculated to be $19,343.40, highlighting the sales scale the dataset represented. The most notable figure was the highest revenue recorded for a single order, amounting to an impressive $78,711.60, providing a glimpse into the potential sales ceiling within the dataset.
Predictive Modeling with Machine Learning
Implementation of RandomForestRegressor
The RandomForestRegressor, a robust machine learning model, was employed to predict future sales trends. Known for its accuracy in regression tasks, this model was chosen for its ability to handle the dataset’s complexities and nuances.
Model Evaluation Metrics
The model’s performance was primarily evaluated using two key metrics: R-squared and Mean Squared Error (MSE).
R-squared: The model achieved an R-squared value of 0.988, indicating a very high level of accuracy in explaining the variance within the sales data. This high value suggests that the model was adept at capturing the general trends and patterns in the dataset.
MSE: Alongside the R-squared, the model’s Mean Squared Error was noted to be approximately 429,278.40. This figure, while seemingly high, needs to be contextualized within the scale of the data. In datasets where financial figures can be quite large, such as in sales data often ranging into the thousands or millions of dollars, an MSE of this magnitude might not be unusually large. However, it does signal that while the model is effective at capturing overall trends, there may be individual predictions where it is less accurate. This could be due to outliers, inherent variability in sales data, or factors not captured by the model.
Reconciling R-squared with High MSE
The juxtaposition of a high R-squared and a high MSE in this context suggests that while the model is generally reliable for understanding and predicting sales trends, caution should be exercised when interpreting predictions for individual data points. It underscores the importance of using multiple metrics to evaluate a model’s performance comprehensively.
Key Insights and Findings
Sales Patterns and Product Performance
- Detailed analysis revealed distinct peak sales periods, allowing for strategic timing in marketing and stock replenishment.
- High-performing products were identified, enabling a focus on items that drive the most revenue.
- The standard deviation in total revenue was $15,586.13, indicating notable variability in sales. This insight is crucial for risk assessment and managing expectations regarding sales consistency.
Customer Purchase Behavior
- Examination of customer purchase patterns unveiled trends that can inform targeted marketing strategies and customer engagement efforts. Understanding these patterns is key to enhancing customer satisfaction and loyalty.
Profitability and Cost Analysis
- A comparative study of sales versus costs shed light on the most profitable products and sales channels. This analysis is instrumental in optimizing pricing strategies and channel focus.
Regional Performance
- Regional analysis showed significant disparities in performance. The best-performing region generated revenue of approximately $721,107.62, while the worst-performing region stood at around $316,394.28. These insights are vital for regional strategy formulation and resource allocation.
Results from Predictive Analysis
- The RandomForestRegressor model, while demonstrating a high R-squared value of 0.988, had a Mean Squared Error of approximately 429,278.40. This indicates a need for cautious interpretation of the model’s predictions, especially for individual data points.
Recommendations and Future Steps
Marketing and Inventory Strategy
- Prioritize stocking and promoting high-performing products, aligning inventory management with observed sales patterns to maximize revenue.
Customized Marketing Campaigns
- Utilize insights from customer behavior analysis to develop personalized marketing campaigns, enhancing customer engagement and conversion rates.
Resource Optimization
- Allocate resources strategically, focusing on the most profitable products and efficient sales channels to optimize financial returns.
Seasonal Sales Strategies
- Leverage insights on peak sales periods for targeted marketing and promotional activities, maximizing sales opportunities during these high-traffic times.
Ongoing Analysis
- Regularly update the predictive model with new data to ensure its continued relevance and accuracy, adapting to market changes and maintaining a competitive edge.
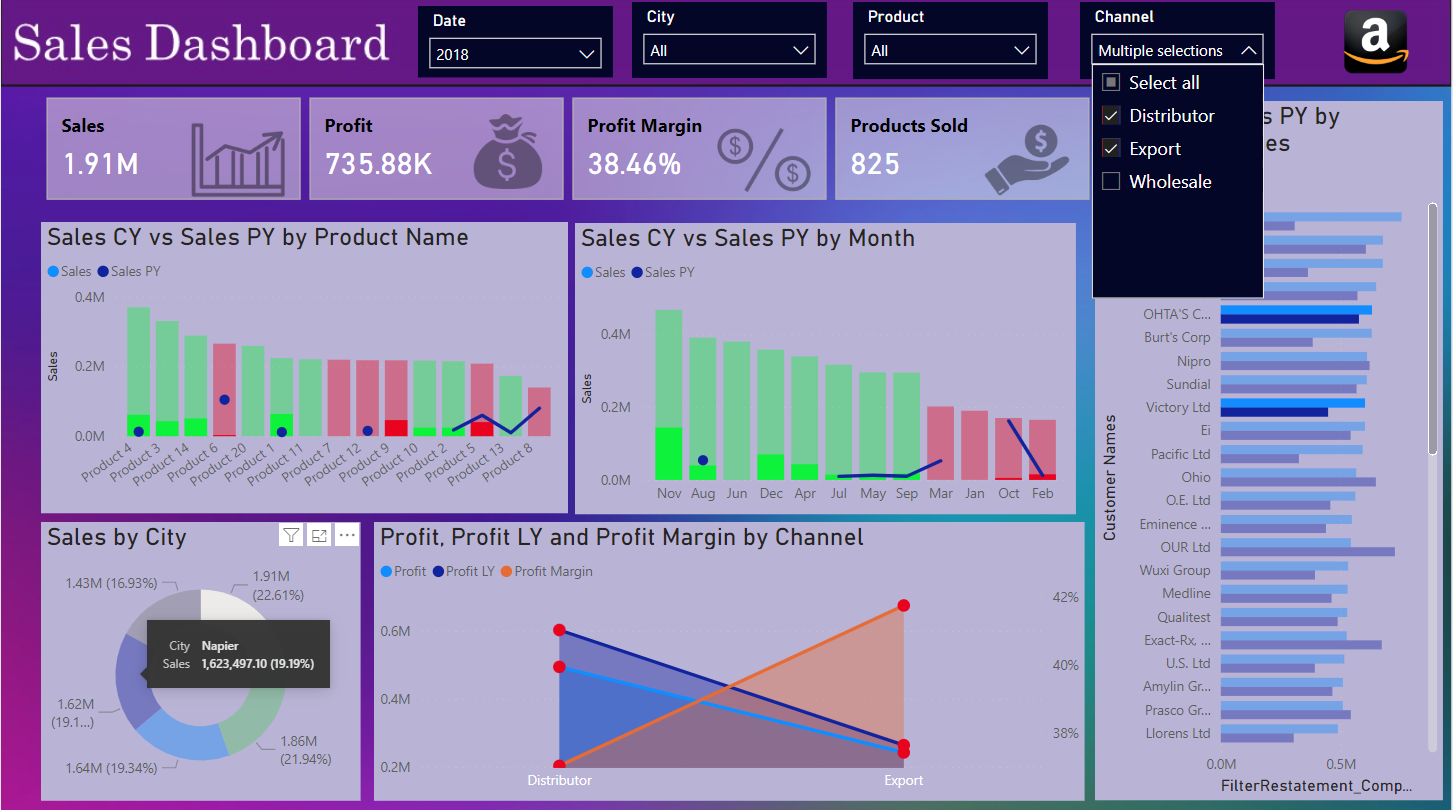
Power BI Visualization and Analysis
The Power BI section of the project entailed the development of a comprehensive sales dashboard, meticulously designed to provide actionable insights. This process was executed in several structured stages, ranging from basic setups to advanced data manipulation and visualization techniques.
Understanding and Preparing Data
- The process commenced with a clear definition of the business problem, ensuring that the Power BI dashboard was tailored to meet specific analytical needs.
- Data loading and cleansing formed the foundation of this process. Utilizing the Power Query Editor, the data was meticulously cleaned, involving tasks such as renaming columns and creating custom columns for crucial calculations like total sales and total costs.
Data Modeling and DAX Application
- A critical aspect of the setup involved data modeling and the creation of a date table using Data Analysis Expressions (DAX). DAX is pivotal for complex calculations and data manipulation within Power BI.
- Establishing relationships between different tables in the data model was a key step, ensuring seamless integration and interaction of data points across the dashboard.
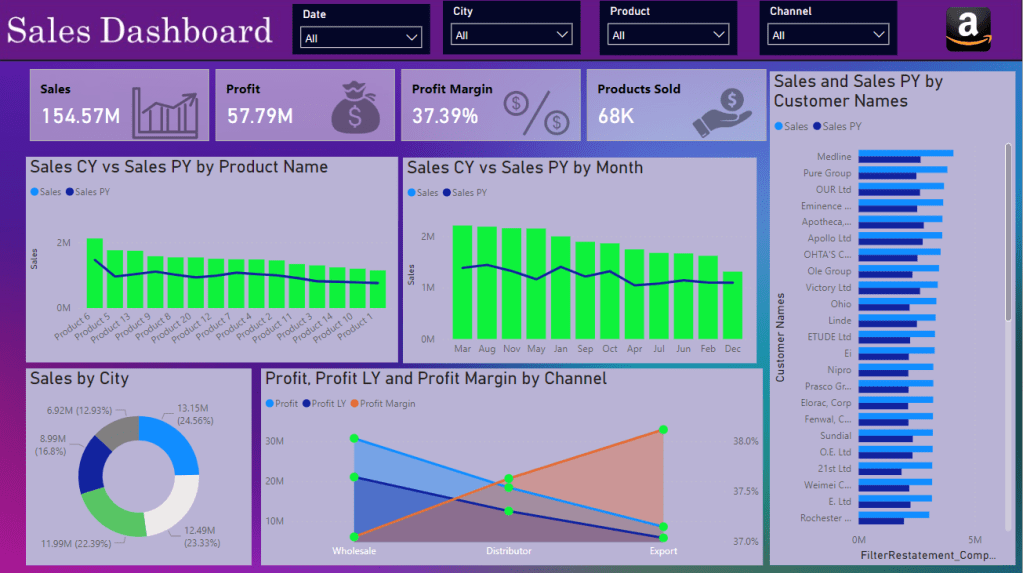
KPI Measures and Visualizations
- The construction of the dashboard involved creating 10-12 DAX measures, calculated columns, and tables, each serving a specific analytical purpose.
- Key Performance Indicator (KPI) measures were developed, providing at-a-glance insights into crucial business metrics.
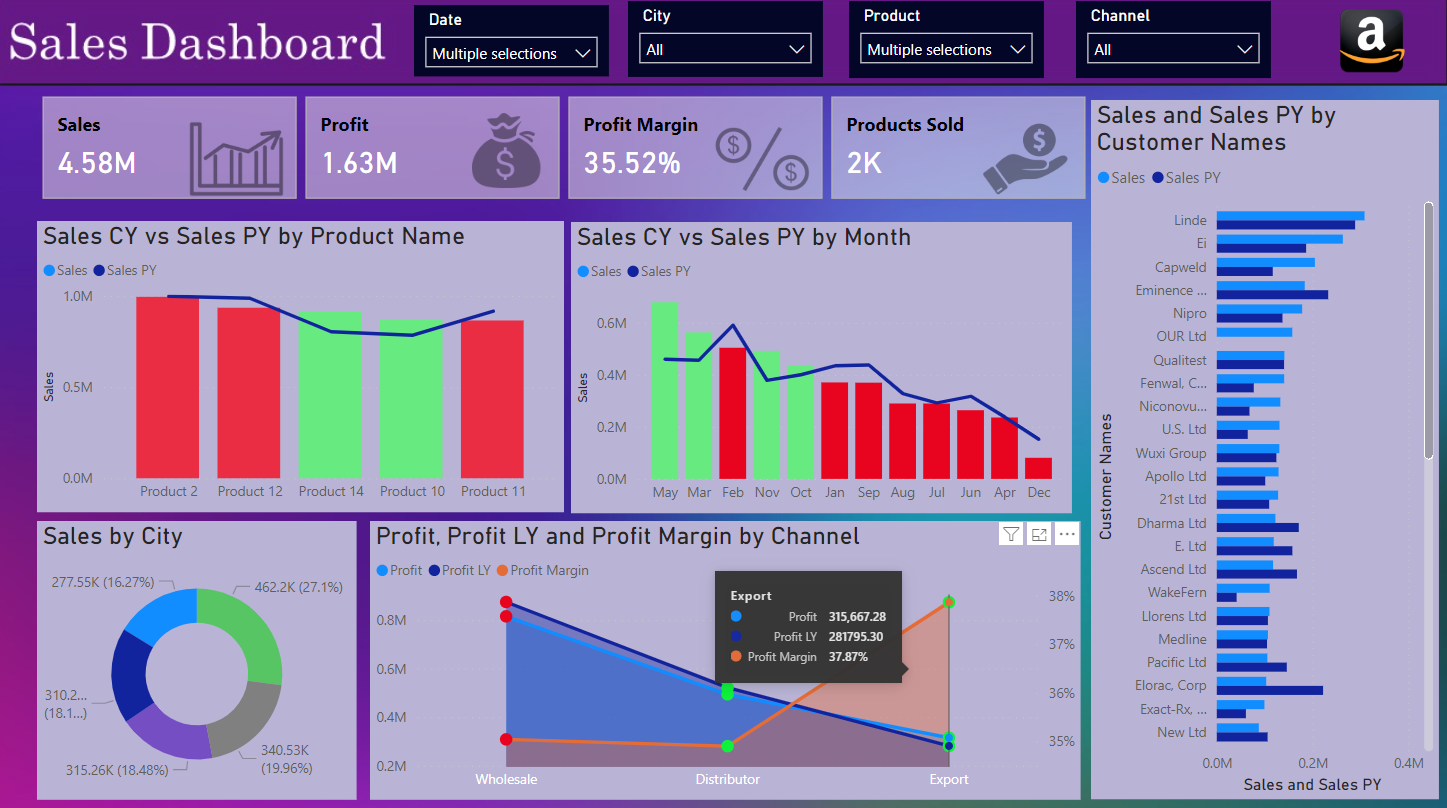
- A variety of visuals were constructed, including slicers for interactive filtering, combo charts, donut charts, and area charts. These visuals were instrumental in comparing sales and profits across different categories and timeframes.
Advanced Features and Insights
- Advanced visualization techniques were employed, such as conditional formatting based on performance metrics and the creation of informative tooltips.
- The dashboard’s design aesthetics were enhanced using custom backgrounds created in PowerPoint, adding a professional and polished look to the report.
Conclusion
This project not only enhanced analytical and machine learning capabilities but also demonstrated the practical application of data-driven decision-making in a business context. The use of advanced tools like Power BI, in conjunction with traditional data analysis methods, highlighted the importance of versatile approaches in the realm of data science. Future initiatives will delve into more complex models and diverse datasets, continually enriching the skill set and expertise in data analytics.