Netflix Analytics Dashboard Development using Power BI and SQL
Tools:
Power BI & SQL
Date:
Winter 2024
In today’s data-centric world, the ability to effectively visualize and interact with complex datasets is a key driver in decision-making processes. This project is dedicated to the creation of a Netflix Analytics Dashboard, leveraging the robust capabilities of Power BI, complemented by the precision of SQL queries. Our aim is to offer comprehensive insights into the vast array of Netflix titles, encompassing both movies and TV series. The project will focus not just on presenting data but on crafting an interactive experience that allows for deep analysis and understanding of content trends, viewer preferences, and the dynamic entertainment landscape.
Objectives:
Development of an Interactive Dashboard:
- Create an engaging and user-friendly Power BI dashboard that leverages advanced features for interactive data visualization, focusing on content popularity, genre distribution, and country-specific trends in Netflix titles.
Application of Advanced Visualization Techniques:
- Employ advanced visualization techniques in Power BI, including conditional formatting, gradient mapping, and dynamic image incorporation, to enhance data presentation and storytelling.
Data Analysis and Insight Generation:
- Utilize the dashboard to analyze and present insights on Netflix content, using metrics such as ratings and votes, and providing a breakdown of movies and TV shows by count and average rating.
Implementation of DAX for Data Manipulation:
- Apply DAX calculations in Power BI for sophisticated data manipulation, focusing on creating a comprehensive data model that includes data cleansing, type setting, and creation of calculated columns and measures.
Methodology:
Data Preparation and Cleansing in Power BI:
- Importing Data: Begin the project by importing the Netflix dataset into Power BI.
- Data Cleansing within Power BI: Focus on cleaning the dataset directly in Power BI, which includes tasks such as renaming columns for clarity and rectifying any inaccuracies or inconsistencies.
Separate Use of SQL for Data Analysis:
- SQL Queries for Data Analysis: Utilize SQL independently for specific data analysis tasks. This involves writing and executing SQL queries to explore various aspects of the Netflix dataset, such as counting the number of movies and TV series, filtering titles based on release years or ratings, and analyzing genre distribution.
- Insights Generation from SQL Analysis: Generate preliminary insights from the SQL query results, which can inform the focus areas and design of the Power BI dashboard.
Dashboard Development in Power BI:
- Interactive Features Implementation: Employ Power BI’s interactive reference cards, advanced slicers, and geom mapping to create a dynamic and engaging user experience.
- DAX Calculations for Enhanced Data Manipulation: Implement DAX calculations within Power BI for sophisticated data manipulation, crucial for creating calculated columns and measures in the dashboard.
- User Navigation and Storytelling Design: Strategically design the dashboard to enhance user navigation and storytelling, adopting a top-down and left-to-right approach.
Data Visualization Techniques:
- Developing Advanced Visualizations: Create various types of visualizations in Power BI, such as bar charts and tables, using conditional formatting and gradient mapping to make data interpretation intuitive and visually appealing.
- Employing Visual Cues: Incorporate visual cues like accent bars in visualizations to enhance data interpretation and user engagement.
Analytical Focus in Power BI:
- Detailed Content Analysis: Analyze ratings, votes, genres, and country-specific information within the Power BI dashboard.
- Insightful Data Visualization: Use the visualizations in the dashboard to generate and present insights, focusing on numerical data to understand trends and patterns in Netflix content.
Expected Outcomes:
1. A Fully Functional and Visually Appealing Netflix Analytics Dashboard:
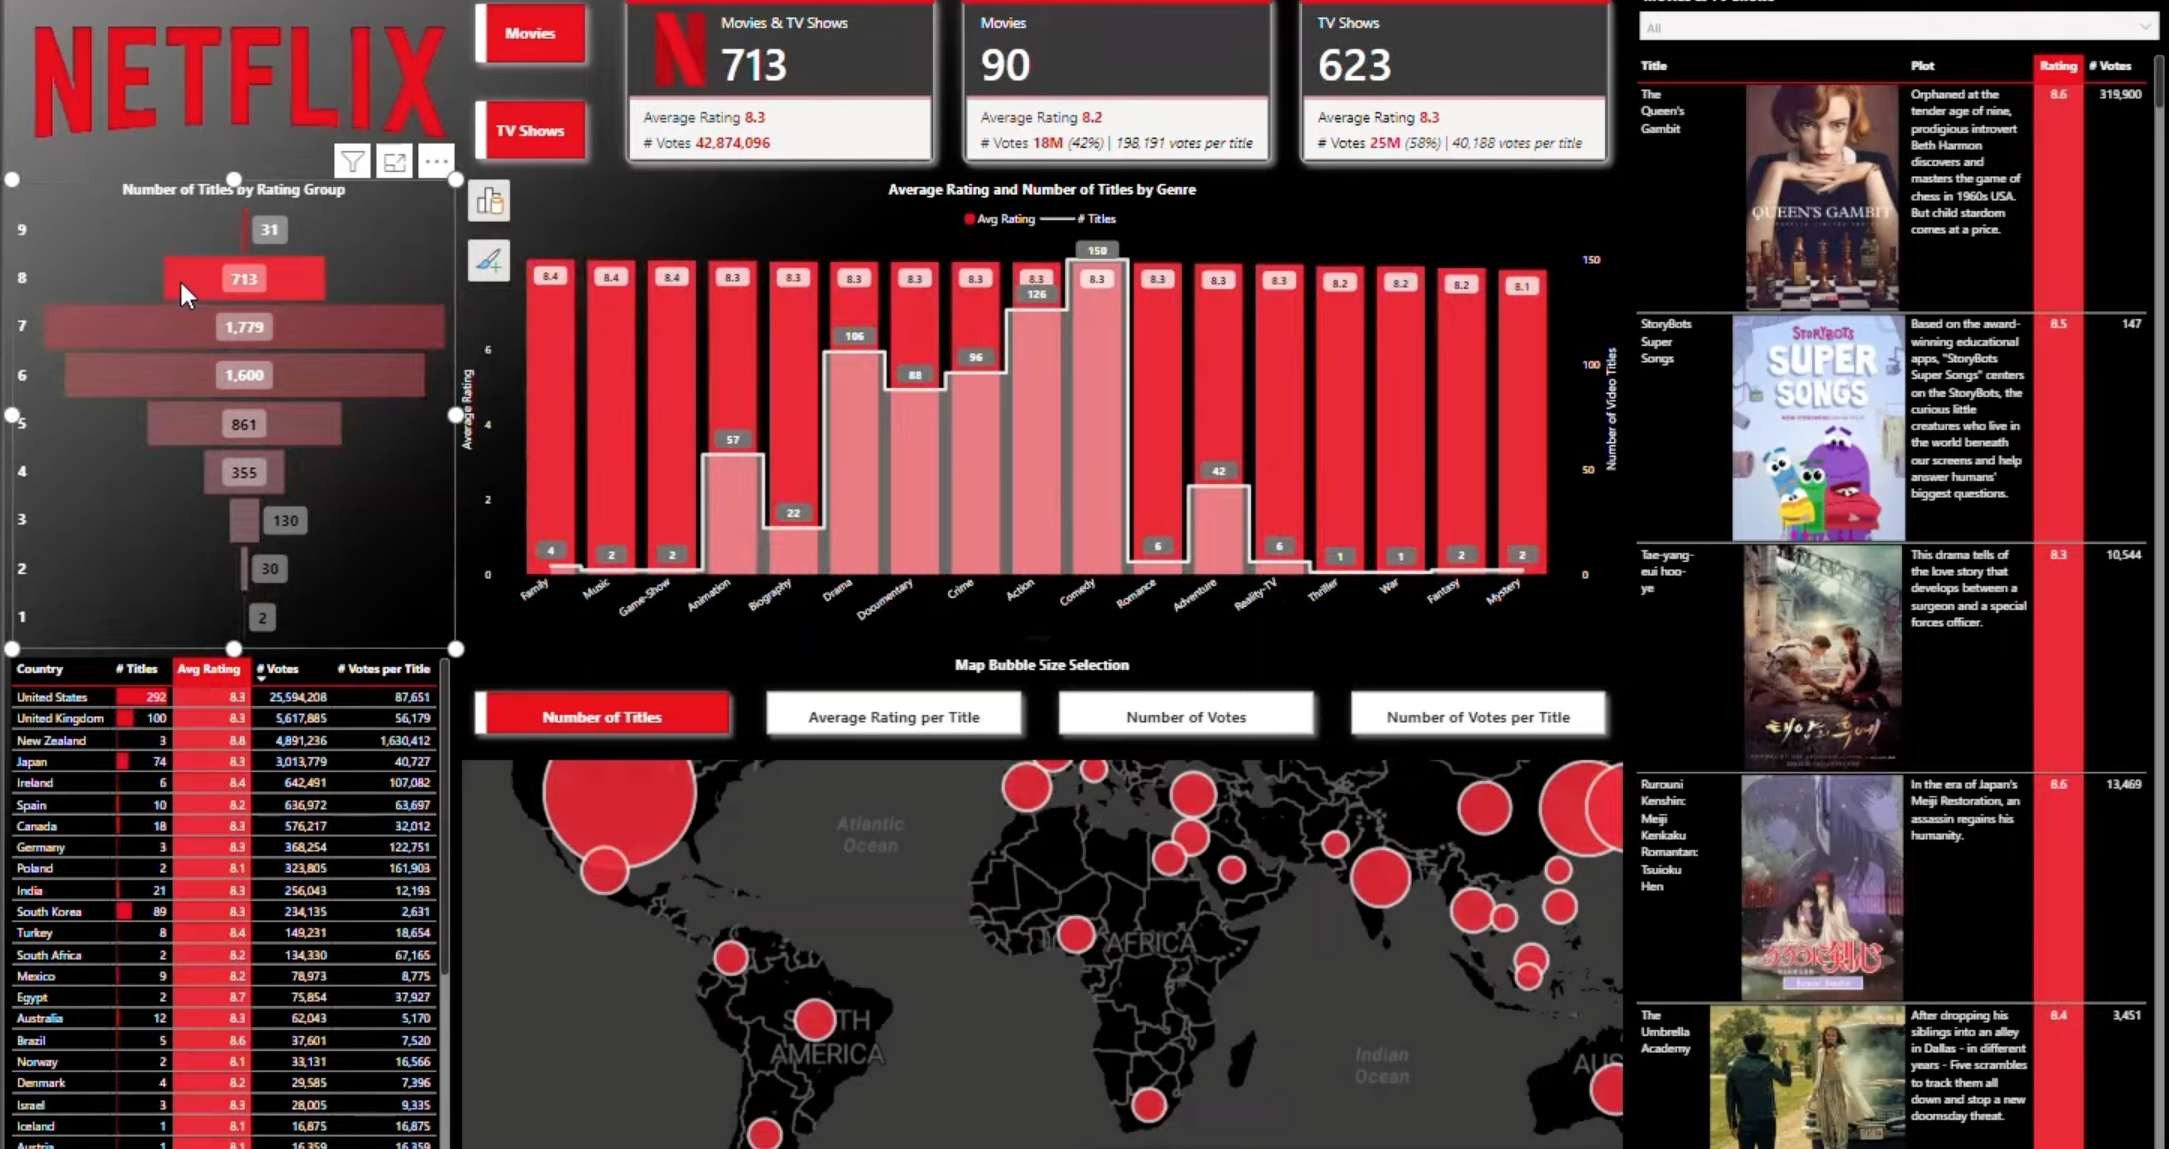
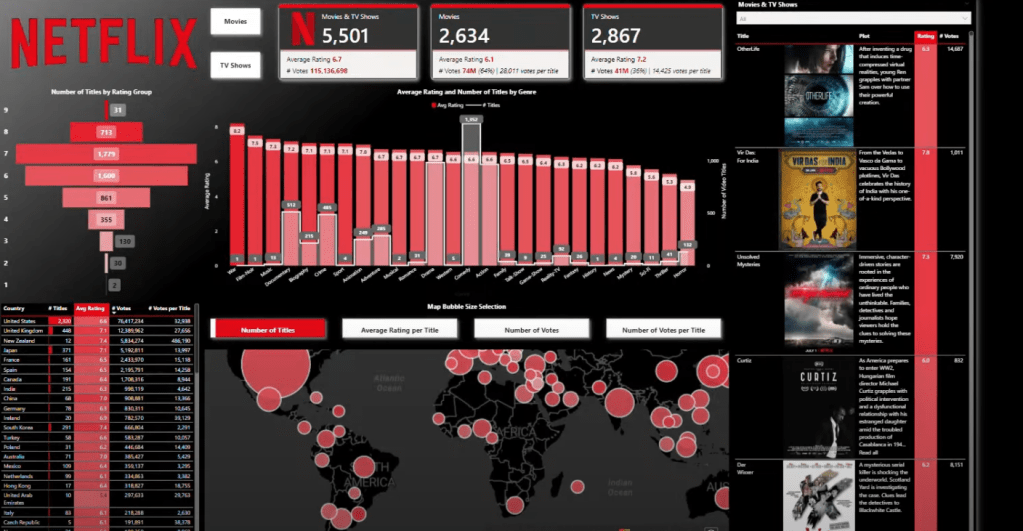
- The creation of an interactive and visually stunning Power BI dashboard that effectively showcases diverse content data from Netflix, including a wide range of genres, with a particular emphasis on the dominance of ‘Drama’ (2812 occurrences).
- The dashboard will highlight key content such as the top-rated movie ‘CM101MMXI Fundamentals’ (rating: 9.2) and the top-rated TV show ‘Stranger Things: Spotlight’ (rating: 9.4), providing a quick snapshot of the highest acclaimed titles.
2. Enhanced Understanding of Netflix Content Trends and User Preferences:
- Detailed insights into content popularity and viewer preferences will be achieved through the analysis of average ratings, with movies averaging a rating of approximately 6.11 and TV shows around 7.18. This distinction in ratings between movies and TV shows will offer a deeper understanding of user satisfaction across different content types.
- The dashboard will also provide a comprehensive view of genre preferences among Netflix viewers, highlighting the popularity and trends within each genre, especially focusing on the most prevalent ones like Drama.
3. Improved Decision-Making Abilities for Stakeholders in Media and Entertainment Industries:
- The analytical capabilities of the dashboard, enriched with specific data points and trends, will enable stakeholders in the media and entertainment industries to make more informed decisions. Insights into viewer ratings, popular genres, and top-rated titles will guide content creation, marketing strategies, and investment decisions.
- The inclusion of detailed numerical visualizations and statistical analysis in the dashboard will facilitate a more nuanced understanding of market trends and audience preferences, essential for strategic planning and forecasting in the dynamic entertainment sector.
Deliverables:
1. A Complete Power BI Dashboard:
- The primary deliverable will be a fully developed Power BI dashboard. This dashboard will be interactive, user-friendly, and visually appealing, showcasing a variety of visualizations based on the Netflix dataset. It will include insights into the most common genres, top-rated movies and TV shows, and average ratings for different types of content.
2. A Collection of SQL Queries:
- A curated set of SQL queries used during the data extraction and analysis phase will be included. These queries will showcase how data was initially analyzed and insights were generated. The queries will cover aspects such as:
- Counting and categorizing different content types (movies, TV shows).
- Filtering content based on specific criteria like release years or ratings.
- Extracting data related to genres, viewer ratings, and other relevant metrics.
SQL QUERIES:
-- Query 1: List all titles and their types
SELECT title, type FROM netflix_listings;

-- Query 2: Count the number of movies and TV series separately
SELECT type, COUNT(*) AS count FROM netflix_listings GROUP BY type;

-- Query 3: Find all titles released after 2010
SELECT title, startYear FROM netflix_listings WHERE startYear > 2010;

-- Query 4: List titles and their ratings where rating is above 8
SELECT title, rating FROM netflix_listings WHERE rating > 8;

-- Query 5: Show the average rating for movies and TV series separately
SELECT type, AVG(rating) AS average_rating FROM netflix_listings GROUP BY type;

-- Query 6: List titles and their genres where the genre includes 'Drama'
SELECT title, genres FROM netflix_listings WHERE genres LIKE '%Drama%';

-- Query 7: Find the top 5 most popular titles in each type (movie or tvSeries)
SELECT title, type, popular_rank FROM (
    SELECT title, type, popular_rank, ROW_NUMBER() OVER (PARTITION BY type ORDER BY popular_rank ASC) AS rn
    FROM netflix_listings
) AS ranked WHERE rn <= 5;

-- Query 8: List the number of titles per language, but only for languages with more than 10 titles
SELECT language, COUNT(*) AS title_count FROM netflix_listings GROUP BY language HAVING COUNT(*) > 10;

-- Query 9: Find titles where the cast includes 'Tom Ellis'
SELECT title FROM netflix_listings WHERE cast LIKE '%Tom Ellis%';

-- Query 10: Calculate the average number of episodes for TV series released after 2000 and having more than 1 season
SELECT AVG(episodes) AS average_episodes FROM netflix_listings WHERE type = 'tvSeries' AND startYear > 2000 AND endYear IS NOT NULL;